
Timebars Resource Scheduler
Visualize and manage your project and resources with ease.
Why Project Managers Choose Timebars
Managing multiple projects across a shared resource pool is hard enough. Timebars gives you a clear, drag-and-drop canvas so you can schedule confidently, respond to change quickly, and report accurately.
All Projects, All Resources — One View
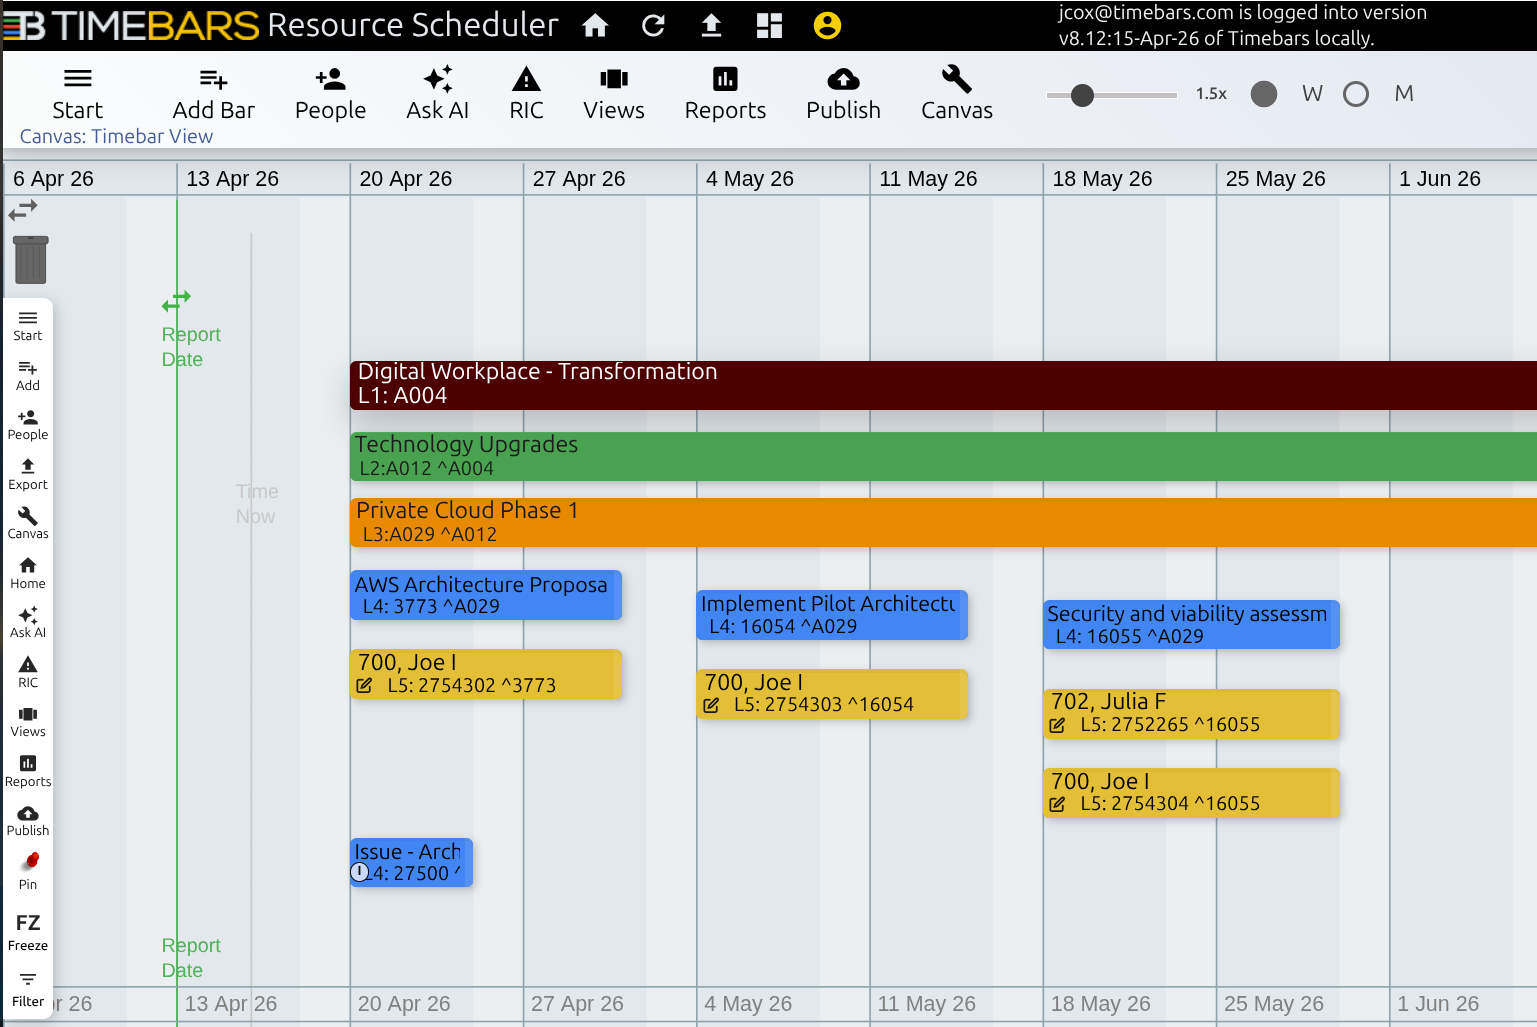
See every project and every resource allocation across your organisation on a single canvas. Scroll through timelines, compare workloads, and spot scheduling conflicts before they become problems.
Stop Overallocating Your Team
Supply and demand charts show you exactly where resources are stretched. Drag tasks to rebalance workloads across projects in real time — no spreadsheet juggling required.
Dependencies That Actually Work
Link tasks with drag gestures and let the scheduling engine cascade changes automatically. When a predecessor slips, successors adjust. When you need to override, constraints give you full control.
Familiar Spreadsheet Input
Configure your resource pool and project data in Excel, LibreOffice, or OpenOffice Calc — tools your team already knows. Drag the spreadsheet onto the canvas and Timebars does the rest.
Baselines and Variance at Your Fingertips
Capture unlimited baseline snapshots with a single click. Compare planned versus actual at any point in the project lifecycle, and present accurate progress reports without assembling data manually.
No Installation. No IT Ticket.
Timebars runs entirely in the browser. Teams can start scheduling the same day, without waiting for software deployment, IT approvals, or complex onboarding processes.
Timebars Presentation
New Project and Resource Management Scheduler
Project scheduling forms the backbone of effective resource management, allowing organizations to visualize work packages and activities across the timeline. In Timebars, this process is dramatically simplified through our intuitive time-phased Canvas and drag-and-drop functionality. Users can quickly build comprehensive project schedules by defining work packages in familiar spreadsheets, then importing data with a simple gesture to begin scheduling instantly – eliminating the traditional time-consuming setup process.
Once tasks are established on the Canvas, the proprietary Timebars scheduling engine automatically calculates dates, durations, work hours, and costs based on intelligent rules. As project managers move or resize tasks, the system dynamically updates forecasts, automatically handling relationships between tasks and calculating percent completion. This rules-based approach ensures accuracy while providing the flexibility to manually override values when necessary, creating an efficient balance between automation and human judgment.
Recommended 5 Step Process
- Configure Resource Pool and Metadata: Download the spreadsheet template through the Hamburger Icon menu, populate the Resources Tab with resource IDs, names, roles, skills, and rates, then drag and drop onto the Canvas to build your centralized resource pool. This same metadata-driven approach allows for organizing projects using custom attributes from a common Tags Table.
- Establish Work Packages, Tasks and Task Relationships: Create Work Packages (usually orange bars), under them create tasks and dependencies between tasks with intuitive drag gestures, ensuring successor tasks automatically adjust when predecessors are rescheduled. Apply Constraints when needed to override automatic adjustments.
- Allocate Resources to Tasks: Assign resources from a centralized pool to specific tasks using the Resource Allocator, with automatic calculation of hours and costs.
- Monitor and Adjust Resource Allocation: Visualize resource usage across the timeline to prevent overallocation and ensure optimal workforce distribution.
- Track Progress Against Baselines: Set unlimited baselines with a single click for enhanced visualization and variance reporting as projects progress.
1. Configure Resource Pool and Metadata Tags
Building Your Resource Foundation
The Resource Pool is the backbone of Timebars' resource management capabilities, serving as a centralized repository for all resources who perform work on tasks. Using Timebars' Spreadsheet Sync feature, you can efficiently build and maintain your resource list with comprehensive metadata including roles, cost rates, skills, and availability. This approach eliminates the tedious process of entering resources one by one through forms or complex interfaces, saving valuable time while ensuring data accuracy.
Metadata and Tagging
Similarly, the Tags Table drives Timebars' metadata organization, providing consistent picklists throughout the application for attributes like Project Manager, Status, and Health indicators. This metadata-driven approach enables powerful filtering, reporting, and visualization capabilities while maintaining data cleanliness. By configuring both resources and metadata through familiar spreadsheet interfaces, you create a solid foundation for efficient resource management before any scheduling begins.
Key resource pool information captured in Timebars:
- Essential identifiers: Resource ID, name, short name, and labor type (human or generic)
- Resource capacity: Workday calendar hours, quantity (supply), and default percent availability
- Financial data: Pay rate for accurate cost calculations and forecasting
- Classification data: Primary role, primary skill, and other organizational attributes

Drag and drop the spreadsheet on the Canvas to import data.

Resource pool spreadsheet template showing configuration options
2. Establish Work Packages, Tasks and Task Relationships
Work Packages & Tasks
The next step is defining your project's structure and relationships. Timebars offers two approaches: 1. Spreadsheet integration for bulk creation of tasks and manual creation of hierarchies, 2. Canvas Bar Creator for direct visual arrangement. As bars are created, they automatically establish parent-child hierarchical relationships, enabling organization of project, workpackage and individual tasks.
Task Relationships
Beyond the inherent hierarchy, Timebars supports explicit task dependencies that define work sequence. These relationships instruct the scheduling engine to automatically reschedule successor tasks when predecessors move, maintaining your project's logic. Creating these relationships is intuitive—simply drag a successor task's beginning edge over a predecessor's ending edge until the red dashed indicator appears. The scheduling engine enforces these relationships during rescheduling, ensuring your project schedule remains intact despite timeline changes.
The power of Timebars' integrated approach to structure and dependencies:
- Efficient creation: Quickly build project structures through spreadsheet import or direct Canvas interaction
- Cascading updates: Moving parent bars automatically repositions all child elements while maintaining internal relationships
- Logical sequencing: Task dependencies ensure work proceeds in the correct order despite schedule adjustments
- Visual clarity: The hierarchical structure provides intuitive organization that mirrors your actual work breakdown

Timebars Canvas showing work packages and task relationships
3. Allocate Resources to Tasks
Matching Skills to Work Requirements
With your project structure and task relationships established, resource allocation brings your plan to life by assigning specific people or generic resources to individual tasks. Timebars makes this process remarkably intuitive through the Resource Allocator - a movable popup that displays your complete resource pool with all associated metadata including roles, skills, and availability. This powerful tool allows managers to make informed decisions when matching resource capabilities to task requirements, avoiding over allocations visually.
Scheduling Engine
As resources are assigned to tasks, Timebars automatically creates gold-colored allocation bars beneath each task, calculating hours and costs based on an intelligent formula: Percent Allocated × Workday Hours × Task Duration. The scheduling engine handles these calculations automatically, providing instant feedback on resource utilization and project costs. Resource allocation can be fine-tuned at any time through the Hours Calculator popup, allowing for precise control over percent allocation without affecting the master resource pool data.
Key capabilities of Timebars' resource allocation system:
- Availability visualization: Double-click any resource to display their current allocation across the timeline before making assignments
- Targeted resource filtering: Quickly locate appropriate resources by filtering the pool by role, skill, or searching by name
- Flexible allocation adjustment: Modify the percent allocation for any resource assignment to front-load, back-load, or level-load resources
- Real-time cost calculation: Instantly see the financial impact of resource assignments based on pay rates and scheduled hours

Resource Allocator interface showing drag-and-drop resource assignment

Use the calculations derived by the Scheduling Engine or override them.
4. Monitor and Adjust Resource Allocation
Optimizing Workforce Distribution
Balancing resource supply and demand is critical for project success, and Timebars provides multiple visualization tools to help managers prevent overallocation while ensuring optimal workforce utilization. The Resource Usage reports offer comprehensive views of allocation data, allowing you to examine demand by hours or FTE, weekly or monthly, and by individual resource, project, or role. These powerful visualizations highlight potential resource conflicts or capacity issues before they impact your schedule, enabling proactive management of your workforce.
Adjusting & Otptimizing
When adjustments are needed, Timebars makes the process remarkably straightforward. You can modify resource allocations directly on the Canvas by editing the percent allocation, reassigning resources to different tasks, or adjusting task durations and timing. As changes are made, the system automatically updates all calculations, providing immediate feedback on the impact of your adjustments in terms of percent allocated as yellow vertical bars at the top. This closed-loop visualization and adjustment capability ensures resources are never overallocated, maintaining team well-being while maximizing productivity.
Multiple perspectives for resource management:
- Canvas timeline view: Yellow vertical bars show individual resource allocation percentages at a glance
- Tabular resource reports: Grid formats display detailed allocation data for precise analysis
- Resource bar charts: Visual representation of supply and demand across time periods
- Resource Usage reports: Comprehensive views of allocation patterns across projects and roles

Resource availability visualization showing allocation across timeline

Resource calculator form to change calculations across timeline
5. Track Progress Against Baselines
Measuring Performance and Variance
As projects move from planning to execution, the ability to compare current status against the original plan becomes essential for effective management. Timebars elevates this capability by supporting multipe baselines, allowing you to capture snapshots of your schedule at any point with a single click. These baselines serve as reference points for measuring progress, identifying variances, and documenting the evolution of your project over time. Timebars gives you complete flexibility to establish baselines at key milestones or decision points and to maintain a history of all baselines taken so they can be reassigned for visual comparison at any time.
Baseline Visualization
The baseline comparison extends beyond simple schedule dates to encompass the full spectrum of project metrics including resource allocations, costs, and percent completion. Timebars' visualization capabilities make these comparisons intuitive, displaying baseline information directly on the Canvas alongside current forecasts for immediate recognition of variances. This comprehensive baseline tracking integrates seamlessly with Timebars' reporting system, generating variance reports that highlight deviations from plan and enabling proactive management decisions before minor issues become major problems.
Key benefits of Timebars' unlimited baseline approach:
- Historical documentation: Maintain a complete record of how your project has evolved over time
- Variance identification: Quickly spot schedule, resource, and cost deviations from planned baselines
- Performance measurement: Calculate and report on schedule and cost performance indicators
- Proactive management: Identify trends and potential issues before they significantly impact the project
How to set a baseline with one click

Visual Baseline comparison showing variance between original plan and current status